How the U.S. Government Guaranteed the Coming Global Food Crisis
Commodities / Food CrisisNov 27, 2010 - 06:31 AMBy: DailyWealth

 Porter Stansberry with Braden Copeland write: Over the last several years, I've written constantly on the growing likelihood of a global currency collapse.
The governments of Europe and the United States have accumulated debts so large they can't ever hope to repay them, except with currencies whose value will be inflated away by money-printing.
If you've been reading the financial press for the past few months, you know the prices of vital food commodities are soaring. The price of corn is up 47% since this summer. Soybeans are up 30%. Wheat is up 43%.
I expect this trend of higher food prices to continue for years as the U.S government intentionally debases the dollar while lying to you the whole time about wanting a "strong currency." (Make sure to read our essay hereabout this great lie.) There's also a good supply/demand case to be made for owning agricultural assets. Let's start with the largest crop in the United States, corn...
In 2009, U.S. farmers grew 39% of the world's corn – 307.4 million metric tons. The crop was worth $48 billion. Our corn exports totaled $8.7 billion.
Most harvested corn in the U.S. is used to feed livestock – 43% of 2009 production. Almost as much (41%) was used for food, consumer, and industrial products (toothpaste, adhesives, cosmetics, starches, sweeteners, oils, beverages, industrial alcohol, fuel ethanol, etc.). The remainder was exported. The U.S. sent most of its corn to Japan, Mexico, and South Korea.
The second-largest corn grower, China, produced 165.9 million metric tons, or half the U.S. production. The European Union was a distant third, harvesting 62.7 million metric tons. Brazil checked in fourth, at 51 million metric tons.
In 2009, a severe drought in China killed millions of bushels of corn. Stockpiles dwindled to alarming levels as the government sold corn to keep the price from rocketing higher. Into 2010, the situation hasn't improved. The Chinese have become net importers of corn for the first time in 16 years. Experts predict China will require 6 million to 8 million metric tons of corn this year.
The Chinese corn crunch reminds the world of the food shortages of 2006-2008. Average global prices for wheat, corn, and soybeans spiked more than 100%. Rice prices surged more than 200%.
This chart of the PowerShares Agriculture Fund (DBA) shows the sharp rise in agricultural commodity prices from 2007 to 2008...
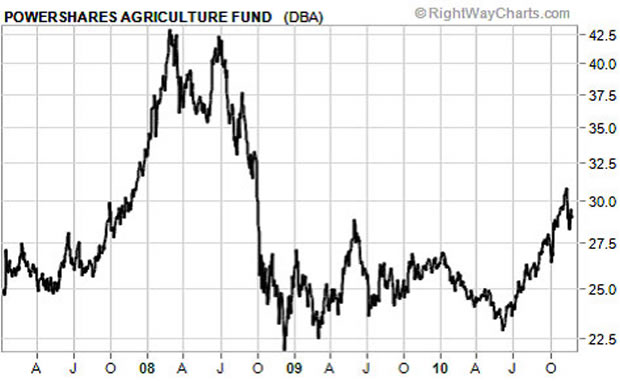
This price rise resulted from changing diets in developing countries and the U.S.'s move to use corn as a fuel source (ethanol). From 2006 to 2008, total global grain consumption increased 3% per year, up from 2% per year from 2000 to 2006. People were eating more meat. You need seven pounds of feed grain to produce one pound of beef.
Increasing affluence leads to a desire for greater luxury in everything, including food. Developing and developed countries are now competing for what they want to eat. And that means prices are going up again.
Notice the right edge of the chart. The price of the DBA basket of agricultural commodities is breaking higher. A large component of this fund is the United State's second largest crop, soybeans.
The U.S. produced $31 billion worth of soybeans in 2009. It's our largest agricultural export. Total exports in 2009 exceeded $16 billion, setting a record.
The U.S. produced almost one-third of the world's soybeans in 2009 (91.4 million metric tons). Brazil and Argentina combined for 50% more of the globe's production. China produced 7%, and India produced 4%.
Soybeans are also used for animal feed. They have twice as much protein content as any other major vegetable or grain. Their protein also makes up many common meat and dairy substitutes, including soymilk and tofu. Soybean oil is used for food and industrial applications.
When it comes to soy consumption, the story has changed in recent years. China has overtaken the U.S. as the leader...
In 2005, China was second, consuming 45 million metric tons of soybeans compared with the U.S.'s 51 million metric tons. Last year, China consumed at least 60 million metric tons. The U.S. consumed less than 50 million metric tons.
Unfortunately for China, its domestic production can't begin to satisfy its growing soybean consumption. In 2009, the Chinese imported more than 45 million metric tons of soybeans. Almost half came from the United States. Chinese producers harvested a little more than 15 million metric tons on their own.
The China National Grain and Oils Information Center is projecting total Chinese imports for 2010 will total 60 million metric tons. That would be a 33% increase over 2009. The U.S. will likely supply half of this. This demand is already driving soybean prices back toward their record 2008 levels of $16 per bushel...
The combination of increasing global demand coupled with the Fed's quantitative easing makes a huge move higher in these commodities (and funds like the DBA) likely. Prices could soar high enough to trigger a global crisis.
When you read about this in the next year or two, don't say you weren't warned... and don't say you aren't prepared.
Good investing,
Porter Stansberry and Braden Copeland


No comments:
Post a Comment